1
2
3
4
5
6
7
8
9
10
11
12
13
14
15
16
17
18
19
20
21
22
23
24
25
26
27
28
29
30
31
32
33
34
35
36
37
38
39
40
41
42
43
44
45
46
47
48
49
50
51
52
53
54
55
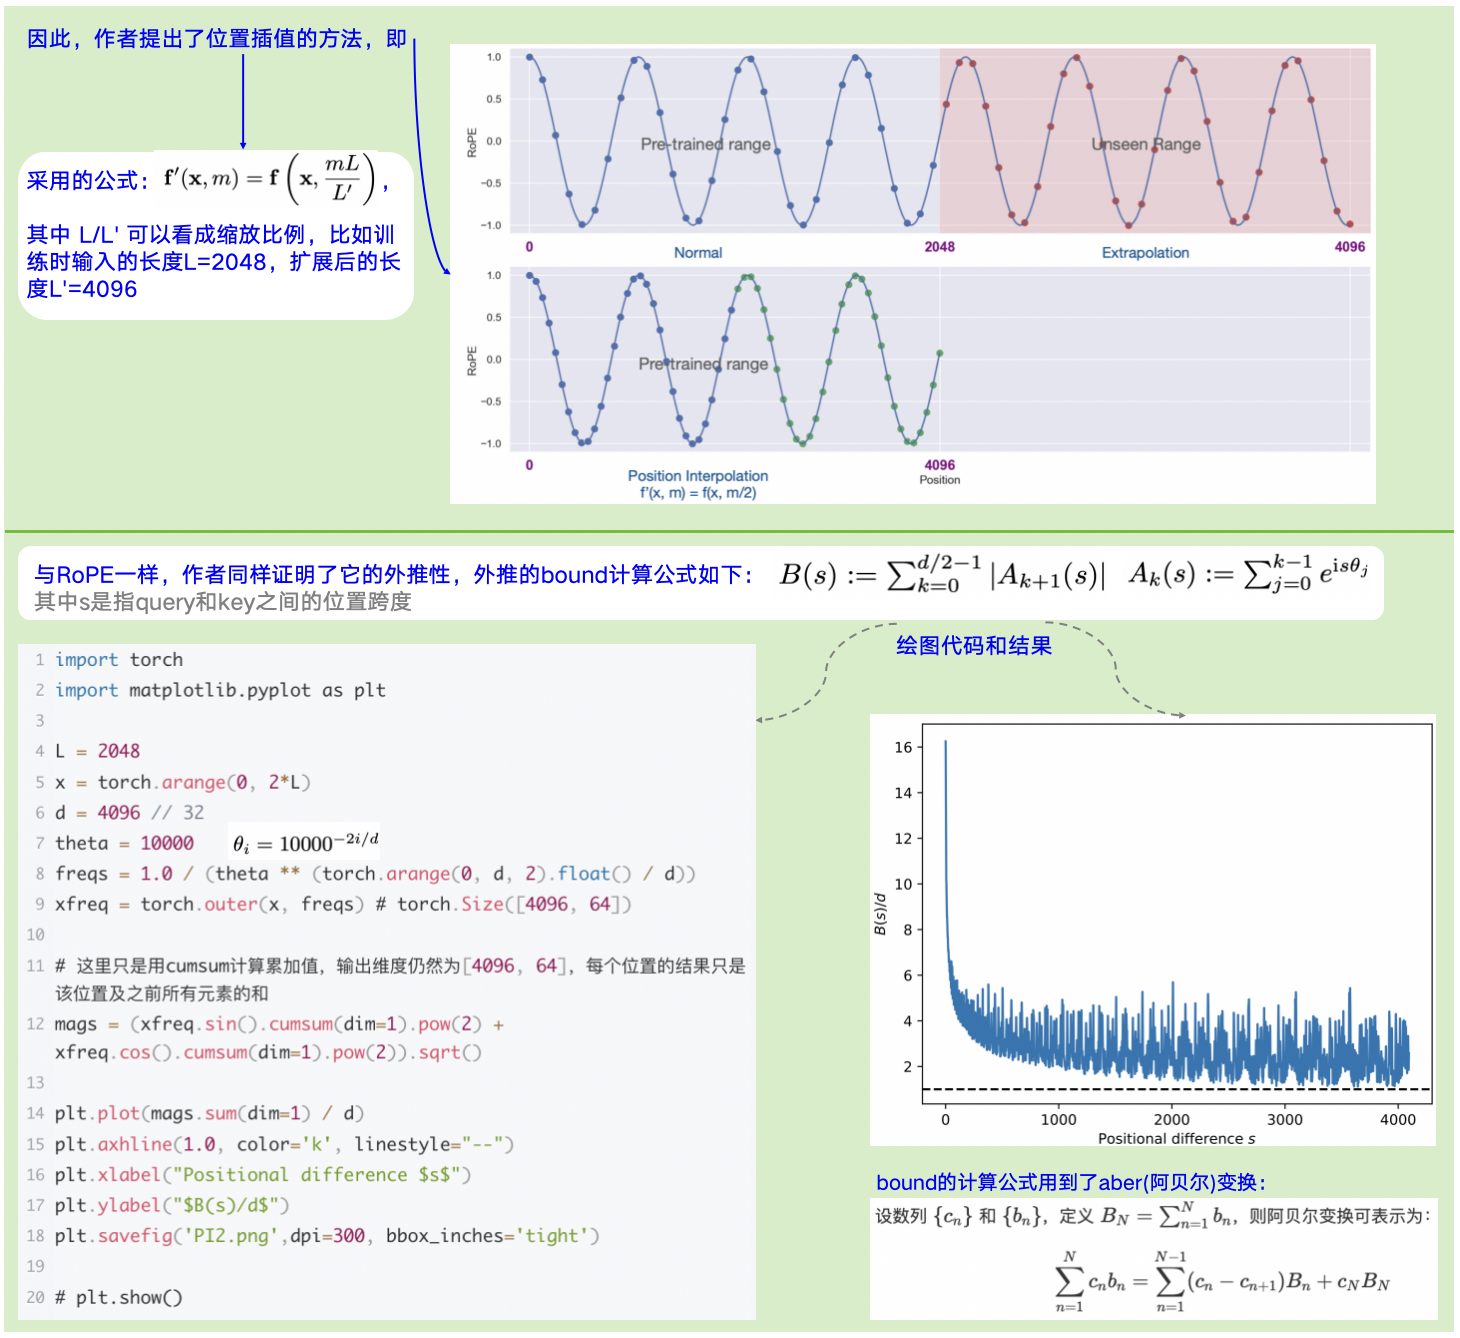
| import torch
import matplotlib.pyplot as plt
d = 4096 // 32
theta = 10000
freqs = 1.0 / (theta ** (torch.arange(0, d, 2).float() / d))
L = 2048
x = torch.arange(0, L)
xfreq = torch.outer(x, freqs)
print(xfreq.shape)
y = torch.randn(x.shape[0])
X = torch.cat([xfreq.sin(), xfreq.cos()], dim=1)
eps = 1e-5
coeffs = torch.linalg.solve(X.t() @ X + torch.eye(X.shape[1]) * eps, X.t() @ y)
x2 = torch.arange(0, 2*L)
xfreq2 = torch.outer(x2, freqs)
X2 = torch.cat([xfreq2.sin(), xfreq2.cos()], dim=1)
y2 = X2 @ coeffs
x3 = torch.arange(25, 75, 0.125)
xfreq3 = torch.outer(x3, freqs)
X3 = torch.cat([xfreq3.sin(), xfreq3.cos()], dim=1)
y3 = X3 @ coeffs
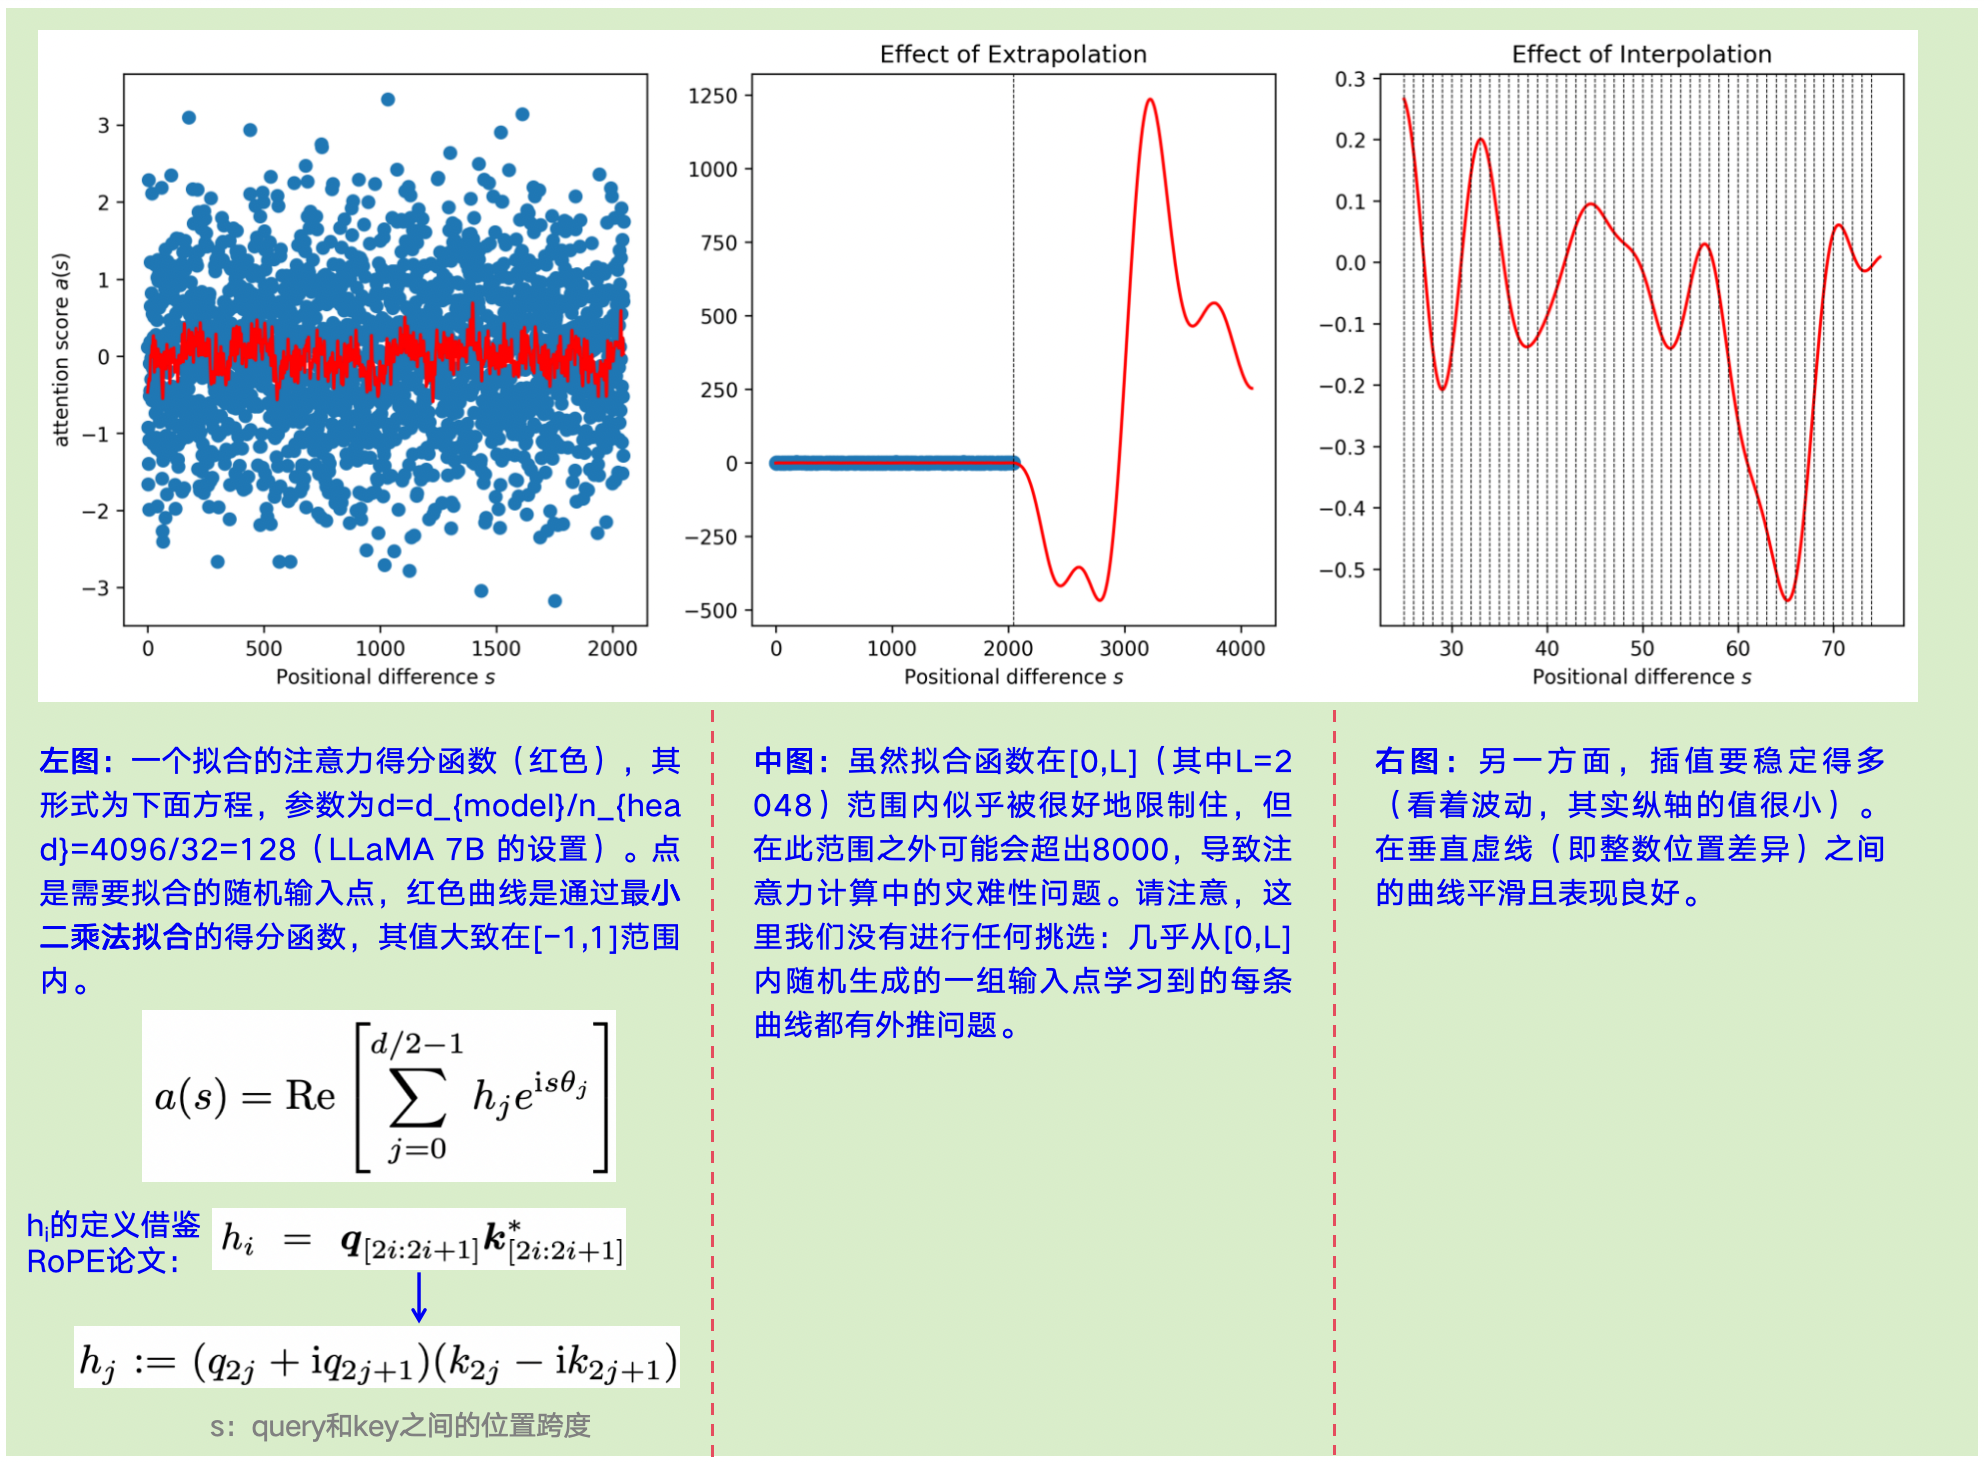
plt.figure(figsize=(16, 5))
plt.subplot(1, 3, 1)
plt.plot(x2[:L], y2[:L], "r")
plt.scatter(x, y)
plt.ylabel("attention score $a(s)$")
plt.xlabel("Positional difference $s$")
plt.subplot(1, 3, 2)
plt.plot(x2, y2, "r")
plt.scatter(x, y)
plt.axvline(L, color="k", linestyle="--", linewidth=0.5)
plt.title("Effect of Extrapolation")
plt.xlabel("Positional difference $s$")
plt.subplot(1, 3, 3)
plt.plot(x3, y3, "r")
for i in range(25, 75):
plt.axvline(i, color="k", linestyle="--", linewidth=0.5)
plt.title("Effect of Interpolation")
plt.xlabel("Positional difference $s$")
plt.savefig('PI.png',dpi=300, bbox_inches='tight')
|